Simple Moving Average Implementation
I have been constantly re-writing the same code to do a quick Simple Moving Average Crossover (SMAC) analysis of a stock price for too long.
I’ve written the below class to do this in one cell. All you need to do is supply the stock ticker (e.g. “AAPL”) and the class will produce either a SMAC dataset or a plot showing a simple implementation of this trading strategy.
import pandas as pd
import pandas_datareader as pdr
import seaborn as sns
import matplotlib.pyplot as plt
import numpy as np

class SMACStock:
  def __init__(self):
    pass

  def check(ticker, long_lb=120, short_lb=50):
    input_data = pdr.get_data_yahoo(ticker)
    signal_df = pd.DataFrame(index=input_data.index)
    signal_df["signal"] = 0.0
    signal_df["short_mav"] = input_data["Adj Close"].rolling(window=short_lb, center=False, min_periods=1).mean()
    signal_df["long_mav"] = input_data["Adj Close"].rolling(window=long_lb, center=False, min_periods=1).mean()
    signal_df['signal'][short_lb:] = np.where(signal_df['short_mav'][short_lb:] > signal_df['long_mav'][short_lb:], 1.0, 0.0)
    signal_df['positions'] = signal_df['signal'].diff()
    return signal_df

  def plot(ticker, long_lb=120, short_lb=50, show_actual=False):
    signal_df = SMACStock.check(ticker, long_lb=long_lb, short_lb=short_lb)
    plt.figure(figsize=(12,8))
    sns.set(context="notebook", style="darkgrid", palette="Blues_d")
    plt1 = sns.lineplot(data=signal_df[["short_mav","long_mav"]])
    if show_actual == True:
      plt1.plot(pdr.get_data_yahoo(ticker)["Adj Close"])
    else:
      pass
    plt1.plot(signal_df.loc[signal_df.positions == -1.0].index, signal_df.short_mav[signal_df.positions == -1.0],'v', markersize=10, color='k')
    plt1.plot(signal_df.loc[signal_df.positions == 1.0].index, signal_df.short_mav[signal_df.positions == 1.0],'^', markersize=10, color='r')
    plt.title(ticker)
    plt.show()
The source code is available here
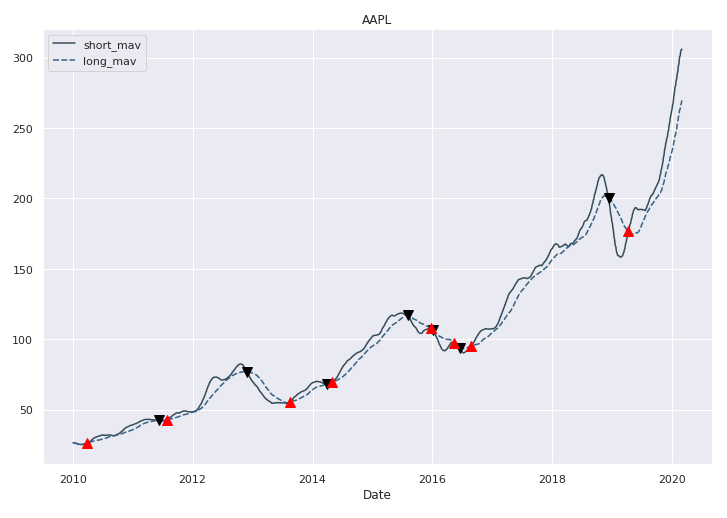
We can now visualise the moves on the following graph. Red markers indicate a BUY signal and Black markers indicate a SELL or SHORT signal.
SMACStock.plot("AAPL")
We can also export this as a pandas dataframe to visualise elsewhere.
SMACStock.check("AAPL")
.png)